
Why This 2026 Marketplace Data Matters
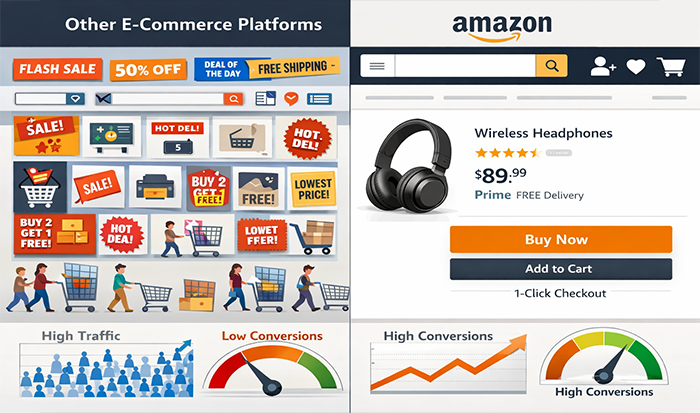
If you sell across multiple channels, you already know that not all traffic behaves the same way. One marketplace may send huge numbers of visitors, but with weaker buying intent.
Another may bring fewer shoppers, but those shoppers convert faster because they arrive ready to purchase. That is exactly why comparing Amazon Marketplaces with other selling platforms matters in 2026.
This Sellerite-style report looks at the gap between traffic and conversion across Amazon and other marketplaces. We are not just asking where sellers get more eyeballs.
We are asking where those clicks turn into purchases more efficiently, and what that means for growth, ad spend, and listing strategy.
The reason this matters right now is simple. More brands are spreading across Walmart Marketplace, Shopify, niche marketplaces, and social commerce channels. But even as those channels grow, Amazon still behaves differently because shoppers often arrive with much stronger purchase intent.
That difference shows up clearly in Amazon Conversion Rate, Amazon PPC Conversion Rate, and the overall efficiency of turning traffic into revenue.
How We Define Traffic And Conversion In This Report
What “traffic” means here
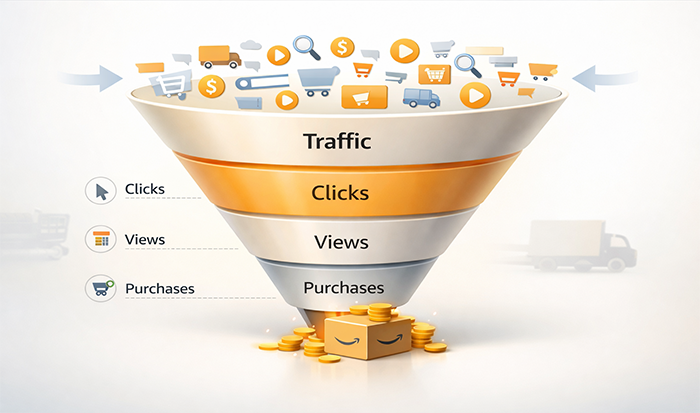
For this report, traffic refers to the volume of shoppers landing on a product page or marketplace environment through both organic and paid channels. That includes internal search traffic, sponsored placements, and in some cases external traffic routed into the platform.
Traffic matters, of course, but by itself it can be misleading. A platform can generate huge visitor volume and still perform poorly if those visitors are browsing casually rather than shopping with clear intent. That is why traffic is only half the story.
What “conversion” means here
Conversion is the part sellers care about most: how often a shopper actually buys after clicking. On Amazon, this is often measured through Unit Session Percentage for listing-wide performance, and separately through ad conversion metrics for sponsored traffic.
This distinction matters because Amazon Conversion is not just a listing metric. It is one of the clearest signals of marketplace quality. If one platform sends twice the traffic but converts at a fraction of the rate, the bigger traffic number can be far less impressive than it first looks.
What The 2026 Data Says About Amazon Vs Other Marketplaces
Amazon still dominates traffic scale
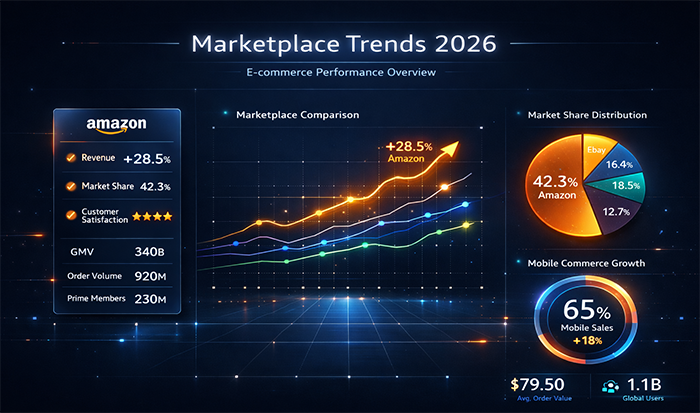
One reason Amazon remains so central for brands is pure traffic volume. A 2025 marketplace comparison noted that Amazon received around 2.82 billion visits in a single month, outpacing Walmart online traffic by roughly 6x. Other comparisons also describe Amazon’s built-in audience as massive, with more than 310 million active shoppers globally using the platform’s ecosystem.
That matters because scale creates opportunity. When sellers launch or optimize on Amazon, they are plugging into a marketplace where purchase-ready demand already exists at enormous volume. On smaller marketplaces, sellers may face less competition, but they usually work with less traffic depth, too.
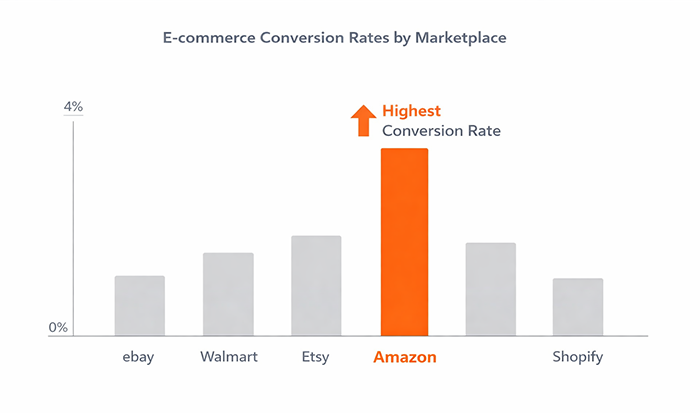
Conversion is where Amazon really separates itself
Traffic scale is important, but conversion is where Amazon often pulls ahead most clearly. Multiple 2025–2026 sources place the average Amazon Conversion Rate in the 9% to 15% range, with well-optimized listings often sitting closer to 10% to 15%.
That is significantly higher than typical standalone eCommerce websites, which several sources place closer to 1% to 4%, with one 2026 benchmark citing 1.33% for non-Amazon eCommerce and another comparison citing around 2.1% for DTC sites.
That gap is huge. It means Amazon traffic is often not just larger, but more valuable per visit. The marketplace attracts people who are already in shopping mode, already trust the checkout environment, and often already have payment information saved.
Amazon Conversion Rate At A Glance
Benchmarks worth paying attention to
Across the current data, several benchmarks show up repeatedly:
- The average Amazon Conversion Rate across product types tends to fall around 9% to 11%.
- Stronger, optimized listings often convert at 10% to 15%.
- Prime-eligible products can see much higher conversion behavior, with one 2026 source citing 15% to 25% for FBA/Prime listings on average.
- Prime shoppers themselves show unusually strong purchase readiness, with several sources citing extremely high buy intent among Prime audiences.
That tells us something important: Amazon Conversions are not just better because of listing quality. They are also better because the platform itself reduces friction. Trust, familiarity, shipping expectations, reviews, and checkout speed all work in Amazon’s favor.
Amazon PPC Conversion Rate Vs Other Paid Traffic Environments
Paid traffic on Amazon converts differently
One of the most useful comparisons in 2026 is paid traffic. According to Ad Badger’s 2026 update, the average Amazon PPC Conversion Rate is 11.55%.
Another 2026 conversion benchmark places average Amazon ad conversion around 9.5% to 11.1%, with strong campaigns commonly landing in the 10% to 13% range and excellent ones above that.
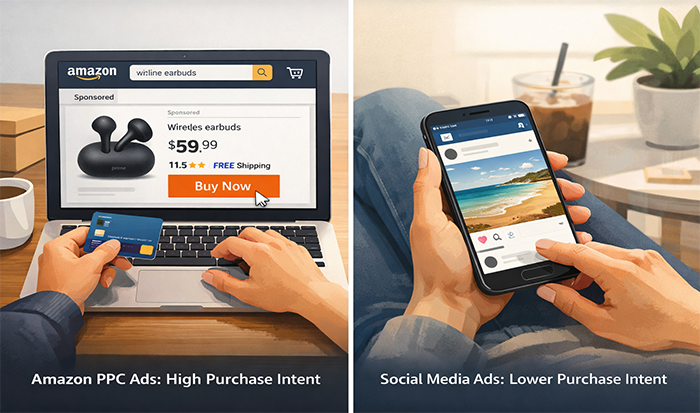
That is a meaningful number because paid traffic elsewhere often performs in a much colder environment. When someone clicks a Google ad or a paid social campaign, they may still be in discovery mode. On Amazon, ad clicks often come from shoppers who are already searching within a buying environment.
This is why Amazon PPC Conversion Rate tends to outperform many off-Amazon paid traffic channels. The shopper is already on the marketplace, often comparing products with intent to purchase soon rather than just browsing casually.
Traffic And Conversion Comparison Table
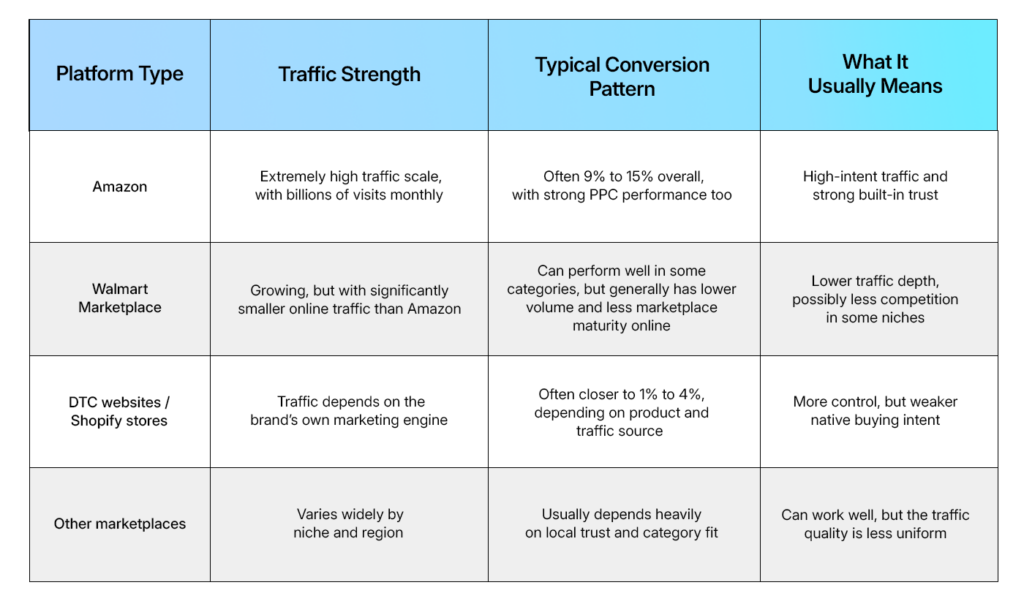
This table helps clarify the real pattern: Amazon is not just a bigger marketplace. It is often a more efficient conversion environment, too.
Why Amazon Converts Better Than Most Platforms
Several recurring reasons show up across the data.
First, Amazon shoppers usually arrive with a stronger intent. They often do not research whether to buy something at all. They are researching which version to buy.
Second, Amazon reduces friction. Prime shipping, easy checkout, familiar returns, and established trust all lower the resistance between click and purchase.
Third, listings are surrounded by buying signals. Reviews, star ratings, badges, delivery estimates, and price comparisons all help buyers make decisions quickly.
This is why Amazon Conversion tends to be structurally stronger than what brands see on their own sites. The platform is built for bottom-of-funnel behavior.
Where Sellers Misread Marketplace Performance
One of the biggest mistakes sellers make is assuming traffic volume alone tells them where to focus. It does not. A channel can send impressive sessions and still perform poorly if conversion stays weak.
Common misreads include:
- Assuming higher traffic means better channel quality
- Judging ads by clicks instead of sales efficiency
- Comparing Amazon and DTC without accounting for buyer intent
- Ignoring how much trust the marketplace itself contributes
- Treating low-converting traffic as “brand awareness” when it is really wasted spend
The better approach is to compare channels through the full lens of traffic quality, conversion efficiency, and cost of acquisition.
A Sellerite-Style Workflow For Cross-Marketplace Evaluation
If you want to compare Amazon Marketplaces with other channels more intelligently, the workflow should stay simple.
A practical approach looks like this:
- Track traffic and conversion separately for each channel
- Benchmark Amazon Conversion Rate against your off-Amazon performance
- Watch Amazon PPC Conversion Rate as a paid-intent benchmark
- Compare customer acquisition cost, not just order count
- Evaluate where strong traffic is actually turning into profitable sales
- Use Amazon as the high-intent benchmark when judging listing quality
This keeps the comparison grounded in performance instead of assumptions.
What This Means For Your 2026 Marketplace Strategy
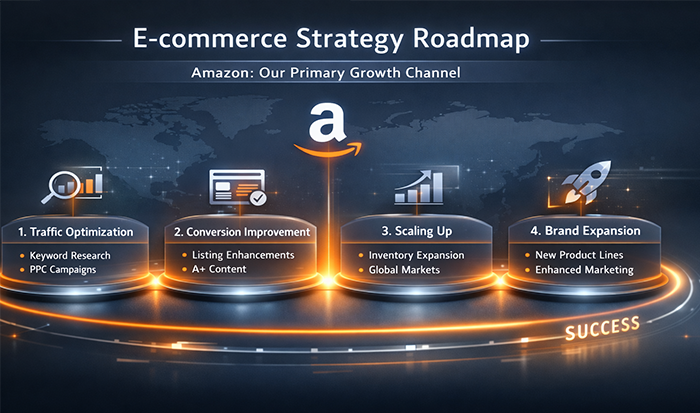
The big takeaway from this report is straightforward: Amazon still leads not just in traffic scale, but in conversion efficiency. Amazon Conversions tend to outperform those on many other platforms because Amazon combines massive reach with unusually high shopper intent.
That does not mean other marketplaces are irrelevant. They can still be valuable for diversification, niche reach, or brand control. But for many sellers, Amazon remains the strongest benchmark for what efficient marketplace demand looks like.
For Sellerite users, the practical move is to stop comparing channels by traffic alone. Use Amazon Conversion Rate and Amazon PPC Conversion Rate as reference points when judging where your listings, ads, and marketplace mix are actually strongest. When you do that, the difference between “more traffic” and “better traffic” becomes much easier to see.
