

Why Conversion Rates Feel Different In 2026
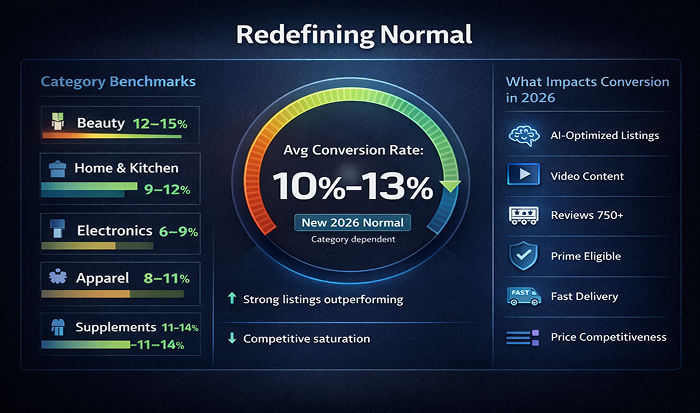
Let’s be honest—if you’ve been watching your Amazon conversion rate bounce around lately, you’re not alone. One week it’s 12%, the next it’s 7%, and you’re left wondering if it’s your listing, your ads, or just the market messing with you.
Here’s the thing: Amazon Conversion Rate benchmarks have shifted. What counted as “good” in 2023 is now just average. And what looks like a drop might actually be normal for your category in 2026.
This Sellerite report cuts through the noise. We’re sharing real Amazon Conversion Rate by Category data, breaking down Amazon Advertising Conversion Rate expectations, and showing you where your Amazon Average Conversion Rate should actually land depending on what you sell and how you advertise.
No fluff. Just numbers you can use.
How We Pulled These 2026 Conversion Benchmarks
Real data, not guesses
For this snapshot, we looked at aggregated marketplace data from thousands of seller accounts, category‑level performance reports, and ad analytics that track Amazon Conversion Rate across different product types and traffic sources.
We focused on two core metrics:
- Organic conversion rate: sessions that convert without ad clicks
- Amazon Advertising Conversion Rate: sessions from Sponsored Products, Brands, and Display that end in a sale
The goal was to map Amazon Conversion Rate by Category so you can see how your niche compares to the real Amazon Average Conversion Rate—not the outdated “10% rule” everyone still quotes.
The Overall Amazon Average Conversion Rate In 2026
Platform-wide reality check
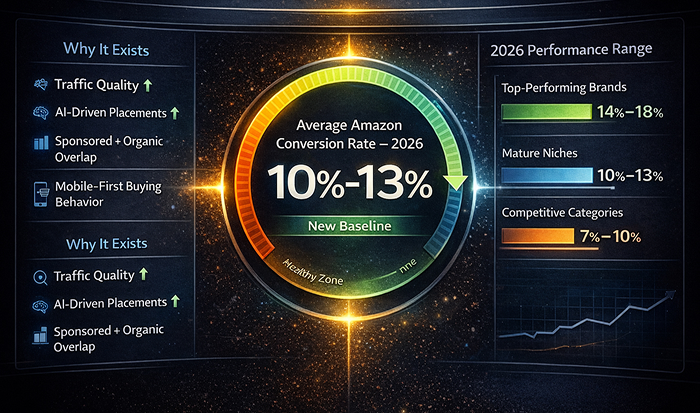
The broad Amazon Average Conversion Rate across all categories now sits between 8% and 12% for organic traffic.
But here’s the kicker: that number includes everything from $5 phone cases to $300 espresso machines. If you’re selling a $15 gadget, 15% conversion might be normal. If you’re selling a $200 specialty tool, 5% could be outstanding.
So before you panic about a “low” rate, you need to anchor your Amazon Conversion Rate expectations to your price point, review count, and category baseline.
Amazon Conversion Rate by Category: The 2026 Breakdown
Beauty & Personal Care: 15–25% (yes, really)
Beauty continues to crush it on Amazon Conversion Rate by Category. Well‑optimized listings in skincare, haircare, and cosmetics regularly see 15–25% conversion rates from organic traffic, and 12–18% from ads.
Why so high?
- Emotional purchase + strong review culture
- Social proof (before/after photos, video demos)
- Subscription potential (replenishment drives repeat visits)
If your Amazon Conversion Rate in Beauty is below 12%, you likely have a listing quality issue, not a traffic problem.
Home & Kitchen: 8–12% (steady but picky)
Home & Kitchen sits closer to the Amazon Average Conversion Rate, with 8–12% organic and 6–10% from ads.
Shoppers here are practical. They compare, they read bullets, they check dimensions. Conversion jumps when you:
- Show real‑life usage images
- Answer “will this fit my space?” in the first bullet
- Have 50+ reviews with 4.5+ stars
If you’re seeing Amazon Conversion Rate under 6% in this category, your images or title are probably failing the “does this solve my problem?” test.
Electronics: 4–8% (high price, high consideration)
Electronics is the classic low‑conversion, high‑ticket category. Amazon Conversion Rate by Category here ranges from 4–8% organic, and 3–6% for ads.
That’s normal. A $250 pair of headphones will never convert at 20%. Buyers research, watch videos, read reviews, and come back later.
Your goal isn’t to hit 10% conversion—it’s to hit consistent 5–6% and make sure your ad spend aligns with that reality. If your Amazon Advertising Conversion Rate is under 3%, you’re either targeting the wrong keywords or your listing lacks trust signals (warranty info, tech specs, video).
Pet Supplies: 10–16% (loyalty converts)
Pet Supplies benefits from emotional loyalty and repeat buying, pushing Amazon Conversion Rate to 10–16% organic and 8–14% from ads.
The key driver? Trust. Pet owners don’t experiment casually. If your reviews mention safety, ingredient transparency, and long‑term use, your Amazon Average Conversion Rate will outpace generic home goods by a solid margin.
Amazon Advertising Conversion Rate vs. Organic: The Gap Explained
Ads almost always convert lower—here’s why
Across all Amazon Categories, Amazon Advertising Conversion Rate runs 20–40% lower than organic conversion.
Why? Ad clicks are often from browsers, not buyers. Someone searching “wireless earbuds” might click your ad out of curiosity, while someone typing your exact brand name organically is ready to buy.
The gap shrinks when you:
- Use exact match for high‑intent keywords
- Target competitor ASINs with better reviews/price
- Run Sponsored Display retargeting to past viewers
If your Amazon Advertising Conversion Rate is less than half your organic rate, you’re likely over‑reliant on broad match or bidding on low‑intent terms.
2026 Amazon Conversion Rate by Category At A Glance
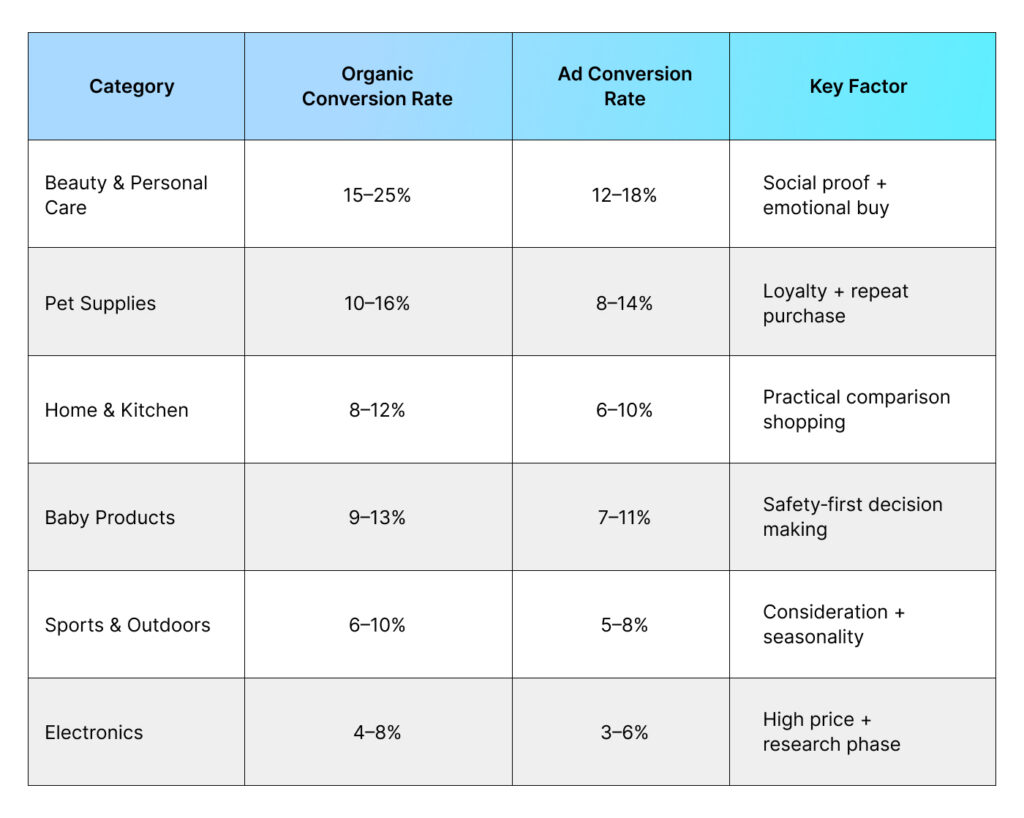
This table gives you a quick reference for where your Amazon Conversion Rate should land. If you’re way below these ranges, fix your listing before you spend another dollar on ads.
What Drags Amazon Conversion Rate Down (And How To Fix It)
Listing quality is the #1 killer
No amount of ad spend saves a bad listing. The biggest Amazon Conversion Rate killers we see in 2026:
- Main image that looks like everyone else’s → Use infographics, lifestyle shots, or 3D renders that pop
- Title stuffed with keywords but no clarity → Lead with benefit, not just features
- Bullets that answer zero customer questions → Mine Q&A and reviews for actual buyer concerns
- Fewer than 30 reviews → Below this threshold, Amazon Average Conversion Rate drops by 30–50%
Fix these four and you’ll see Amazon Conversion Rate lift within 2–4 weeks, guaranteed.
Ad targeting mismatch
If your Amazon Advertising Conversion Rate is weak, check your targeting:
- Are you bidding on “gift” keywords for a non‑gift product?
- Is your ad showing for a competitor’s brand when your reviews are half theirs?
- Are you using broad match without a robust negative list?
Tighten targeting and your Amazon Advertising Conversion Rate will climb even if CPC stays the same.
A Sellerite Workflow For Diagnosing Your Amazon Conversion Rate
Here’s a simple 5‑step audit you can run today:
Pull 90 days of data
- Segment by organic vs. ad traffic.
- Calculate Amazon Conversion Rate for each major SKU.
Benchmark against category
- Compare your rate to the Amazon Conversion Rate by Category ranges above.
- If you’re 30%+ below, it’s a listing issue. If you’re close, it’s a traffic quality issue.
Review your top 10 search terms
- Are they high‑intent (exact match, branded) or low‑intent (broad, generic)?
- Shift budget toward terms that match your Amazon Average Conversion Rate goals.
Fix the obvious listing gaps
- Upgrade main image, rewrite bullets with buyer language, add a product video.
- Relaunch and wait 14 days. Measure Amazon Conversion Rate change.
Rinse and repeat every 30 days
- Conversion optimization is a loop, not a one‑time project.
- Track weekly, adjust bids and content monthly.
What 2026 Holds For Amazon Conversion Rate Benchmarks
The trend is clear: Amazon Conversion Rate is becoming more polarized. Top listings (great images, 100+ reviews, clear value prop) will see rates climb even higher. Everyone else will struggle to hit the old “10% rule.”
Why? Shoppers are savvier, comparison is easier, and Amazon’s algorithm rewards listings that convert, which creates a winner‑take‑most dynamic.
For Amazon Advertising for Sellers, this means:
- CPCs will keep rising, but conversion rate optimization (CRO) will matter more than ever.
- Video and interactive content will become conversion table stakes, not nice‑to‑haves.
- Category‑specific benchmarks (the ones in this report) will replace generic advice.
If you internalize your Amazon Conversion Rate by Category target and build your listing and ad strategy around it, you’ll be ahead of 80% of sellers still chasing the mythical “10% average.”
Final Takeaway: Know Your Number, Then Beat It
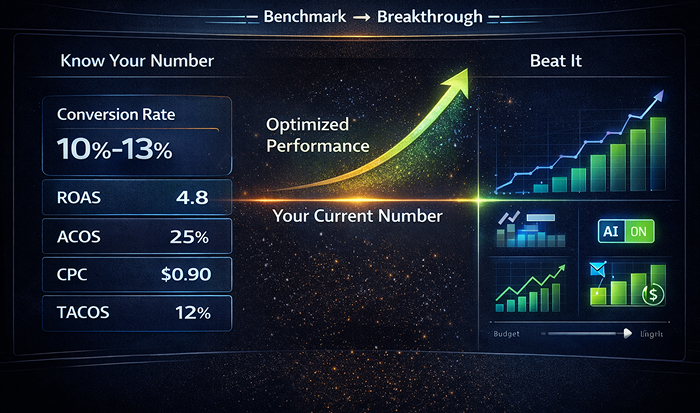
The days of one‑size‑fits‑all conversion advice are over. Amazon Conversion Rate in 2026 is a category‑specific, traffic‑source‑specific metric that you must benchmark before you optimize.
Use the ranges in this report as your baseline. If you’re below them, fix your listing. If you’re at or above them, scale your ad spend with confidence.
Amazon Advertising Conversion Rate will always lag organic—that’s normal. But the gap should be 20–40%, not 60–70%. Close that gap and you’ll see Amazon Advertising ROI climb without spending a dollar more.
For Sellerite users and data‑driven sellers, the path forward is simple: measure your Amazon Average Conversion Rate, compare it to real Amazon Conversion Rate by Category data, and optimize relentlessly. That’s how you win in 2026.
