
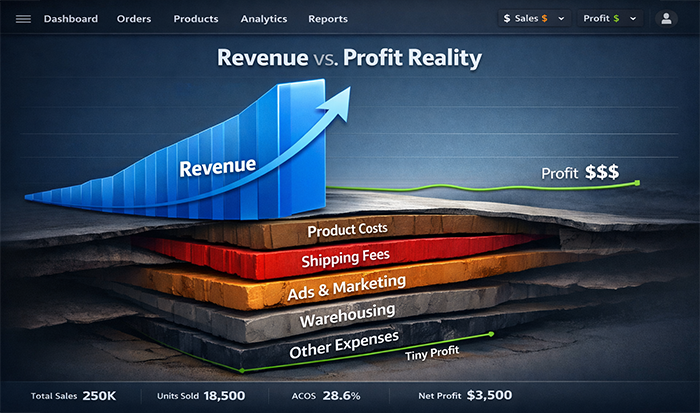
Introduction — revenue is easy to celebrate, profit is harder to protect
A lot of Amazon sellers hit a point where sales look “healthy” on the dashboard, but cash in the bank feels strangely thin. That gap is usually not a product problem—it’s a cost-visibility problem.
A true Amazon Profitability Analysis asks a simple question: after Amazon fees, fulfillment costs, returns, and ads, what’s actually left?
In 2025–26, this matters more than ever because competition pushes sellers to use more paid traffic, faster delivery expectations increase fulfillment complexity, and small pricing mistakes can erase margins quickly.
This research report breaks down the Cost of Selling on Amazon in a seller-friendly way, including where Amazon Seller Profit Margins quietly leak—and how to measure it before scaling.

Methodology — how the “true cost” was modeled
Amazon doesn’t charge one flat fee. Costs stack in layers, and which layers apply depends on your selling plan, category, fulfillment method, and marketing choices. Amazon itself describes standard selling fees as a combination of selling plan fees and referral fees, with additional costs possible if you use optional services like Fulfillment by Amazon (FBA) or Amazon Ads.
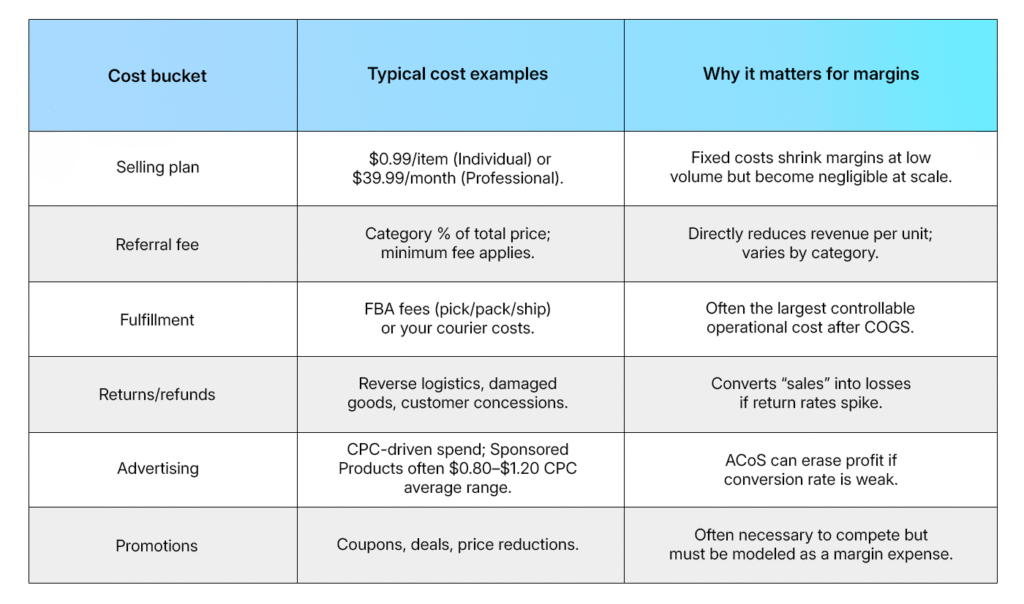
This analysis uses that same structure and organizes total costs into five buckets:
- Fixed account costs (selling plan)
- Variable marketplace fees (referral, closing fees where applicable)
- Fulfillment costs (FBA or merchant fulfillment)
- Customer friction costs (returns, refunds, concessions, damages)
- Growth costs (Amazon Advertising Cost Impact and promo spend)
The cost stack — what “Cost of Selling on Amazon” really includes

Think of Amazon costs like a layered cake. Every seller pays some layers, but not everyone pays all layers equally. Amazon explains two core fee types—selling plan fees and referral fees—and then notes additional costs may apply for optional tools/programs like FBA and Amazon Ads.
Layer 1 — Selling plan fees (fixed or per unit)
On Amazon’s standard fee page, Amazon lists two selling plans:
- Individual: $0.99 per item sold.
- Professional: $39.99 per month.
In practice, many scaling sellers pick Professional because it unlocks bulk tools and operational features, but the correct choice depends on volume and workflow needs.
Layer 2 — Referral fees (category-dependent and easy to underestimate)
Amazon states referral fees vary by product category and are charged as a percentage of the total price (including shipping) or a minimum amount, whichever is greater.
That means referral fees behave like a “sales tax” on your revenue—if you don’t model them correctly, your margin forecast is automatically wrong.
A quick reality check from Amazon’s published referral fee examples:
- Home & Kitchen: 15% (minimum $0.30).
- Computers: 8% (minimum $0.30).
- Clothing & Accessories: tiered, including 17% for items priced over $20 (minimum $0.30).
Layer 3 — Fulfillment costs (FBA vs merchant fulfillment)
Even Amazon’s own pricing guidance emphasizes that using optional services like Fulfillment by Amazon can add costs.
While specific FBA per-unit fees vary by size/weight and change over time, what matters for profitability is that fulfillment is often your second-largest cost after product cost—especially in low-ticket items where per-unit fees represent a high percentage of the selling price.
Layer 4 — Returns and post-sale costs (the invisible margin killer)
Returns don’t just cost the refund amount. They create extra shipping, damaged inventory, restocking effort, and sometimes negative review impact.
This is why two products with identical gross margins can deliver totally different net margins depending on category return behavior and packaging durability.
Layer 5 — Amazon Advertising Cost Impact (the “growth tax”)
Amazon explicitly lists Amazon Ads as an optional cost that may be added on top of selling fees.
In competitive categories, ads often move from “optional” to “necessary,” because ads can stabilize visibility when organic rank fluctuates.
A 2025 advertising cost benchmark source reports average cost-per-click ranges of roughly $0.80–$1.20 for Sponsored Products, $1.50–$2.50 for Sponsored Brands, and $0.70–$2.50 for Sponsored Display.
Those ranges don’t guarantee what you’ll pay, but they’re useful for budgeting and for stress-testing your margins against realistic acquisition costs.
The “true cost” checklist (what to include in profitability math)
This table turns Amazon Profitability Analysis into a repeatable checklist, so profitability conversations don’t get stuck at “revenue looks good.”
Category economics — why Amazon Seller Profit Margins vary so much
Two sellers can both say “I make 30% margin,” but they might mean different things. One might be talking about gross margin (before fees), while the other is talking about net margin (after everything). That’s why Amazon Seller Profit Margins vary widely by category, even with similar pricing.
Categories with heavier fee pressure
Clothing is a classic example: Amazon’s referral fee schedule includes higher tiers like 17% for items above $20, which means you start with a larger marketplace fee burden before returns and ads even enter the picture.
If returns are high (common in size/fit categories), a product that looks profitable on paper can become a break-even item at scale.
Categories with “fulfillment sensitivity”
Low-priced, bulky, or fragile items are fulfillment-sensitive. Even when the referral fee is stable, logistics costs can dominate unit economics. Amazon encourages sellers to use its Revenue Calculator to estimate FBA costs and compare Amazon fulfillment to self-fulfillment, reinforcing that fulfillment is a major variable in profitability planning.
Categories where ads become mandatory faster
When a category is crowded and customers compare heavily, ads become a bigger part of your cost structure. Using the CPC ranges reported for 2025, even a modest click volume can create meaningful daily spend, so conversion rate and ACoS discipline become profit levers, not just marketing metrics.
Bullet list — common profitability leaks sellers miss
These are the “death by a thousand cuts” items that show up in real Cost of Selling on Amazon calculations:
- Using revenue as the KPI instead of contribution margin per unit (profit after fees, fulfillment, and ads).
- Ignoring referral fee tiers and minimums, which Amazon clearly states apply by category and total price.
- Treating ads as optional, then being forced into high bids after losing rank.
- Underestimating returns cost, especially in categories where packaging and expectations matter.
- Not modeling promotions as a cost (coupons and deals often behave like a second referral fee).
- Forgetting fixed costs like the Professional selling plan fee ($39.99/month) when volume is still low.
A simple seller-friendly profitability model (use this before scaling)
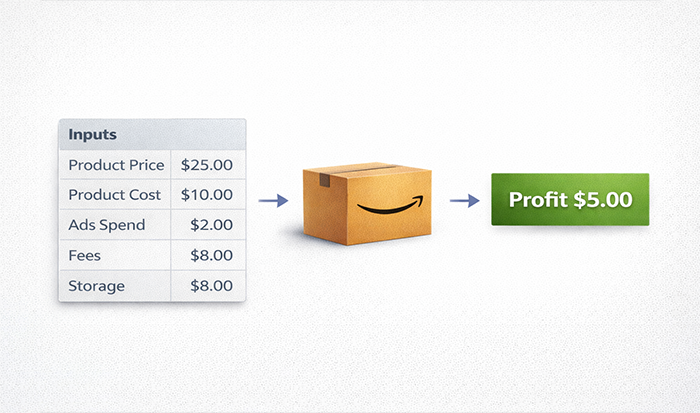
To make Amazon Profitability Analysis practical, a simple per-unit model is often enough to catch most problems early:
Net profit per unit = Selling price
- Referral fee (category %)
- Fulfillment cost (FBA or merchant)
- Advertising cost per order (click cost × clicks per order)
- Returns allowance (your expected % return loss)
- COGS (product + packaging + inbound freight)
The goal isn’t perfection—it’s to avoid scaling something that’s structurally unprofitable.
Closing insight — the healthiest sellers optimize profit systems, not just sales
Amazon makes it very clear that selling fees are only one part of the picture, and that optional programs like FBA and Amazon Ads can add meaningful costs.
Once those layers stack together—referral fees, fulfillment, and the Amazon Advertising Cost Impact—profitability becomes a system you design, not a result you hope for.
If you want, share one sample product (price, category, size/weight, and whether you’re using FBA), and this framework can be turned into a mini profit-and-loss example your client can immediately understand.
