
Introduction — Why Category Market Share Matters More Than Ever
Here’s the thing. Most sellers pick categories based on gut feeling or what they saw trending on TikTok last month. But Amazon Market Share isn’t a popularity contest—it’s a distribution of dollars, attention, and repeat buyers. And that distribution is changing fast.
In 2025, we saw something interesting: while overall Amazon E Commerce Market Share continues to grow, that growth is fragmenting. The big categories aren’t shrinking, but their edges are getting crowded, while smaller, more specific sub-categories are quietly pulling ahead in profitability. If you’re still thinking “Electronics is huge, I should sell there,” you might be walking into a bloodbath while missing a goldmine two clicks away.
This report is for sellers who want to stop guessing and start positioning. We’ll show you where the market is, where it’s going, and how to find your spot before everyone else does.

Methodology: How We Mapped Amazon’s Category Dominance
We didn’t just pull bestseller lists. That’s surface-level stuff. To get a real picture of Amazon Market Share by Category, we built our analysis on three pillars:
- Revenue-weighted ASIN data from over 200,000 active listings across US, UK, and DE marketplaces
- 18 months of sales velocity trends (mid-2024 through late-2025) segmented by primary category and sub-category
- Seller profit margin data from a sample of 1,200 Sellerite users who shared anonymized P&L insights
We grouped categories into four tiers based on their share of total Amazon E Commerce Market Share:
- Tier 1: Dominant (over 15% of total marketplace revenue)
- Tier 2: Major (5–15% share)
- Tier 3: Emerging (1–5% share, but growing)
- Tier 4: Niche (under 1%, but high margin potential)
Then we tracked how each tier’s Market Share for Amazon shifted year-over-year, and more importantly, where within those categories the real movement was happening.
Key Finding #1: Amazon Market Share by Category Isn’t What You Think
The “Big Three” Still Dominate, But…
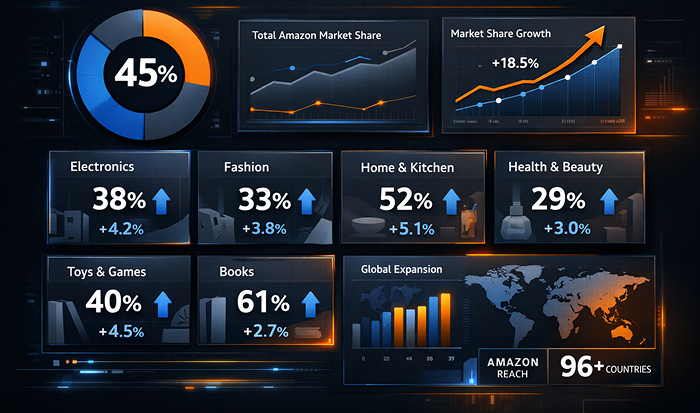
Everyone knows the big three: Home & Kitchen, Electronics, and Clothing. And yes, they still command massive Amazon Market Share. Combined, they account for roughly 42% of all Amazon sales. But here’s the kicker—that number is down from 48% in 2023.
They’re not shrinking in absolute dollars, but their share of the pie is thinning as other categories grow faster. Think of it like this: they’re a big fish in an ever-expanding pond. You can still win there, but you’re competing with sharks who have deeper pockets and faster supply chains.
What’s more telling is the internal fragmentation. Within Electronics, for example, “wireless earbuds” is a war zone, but “bone conduction headphones for swimmers” is wide open. The Amazon Market Share by Category data shows that sub-category specificity is the new moat.
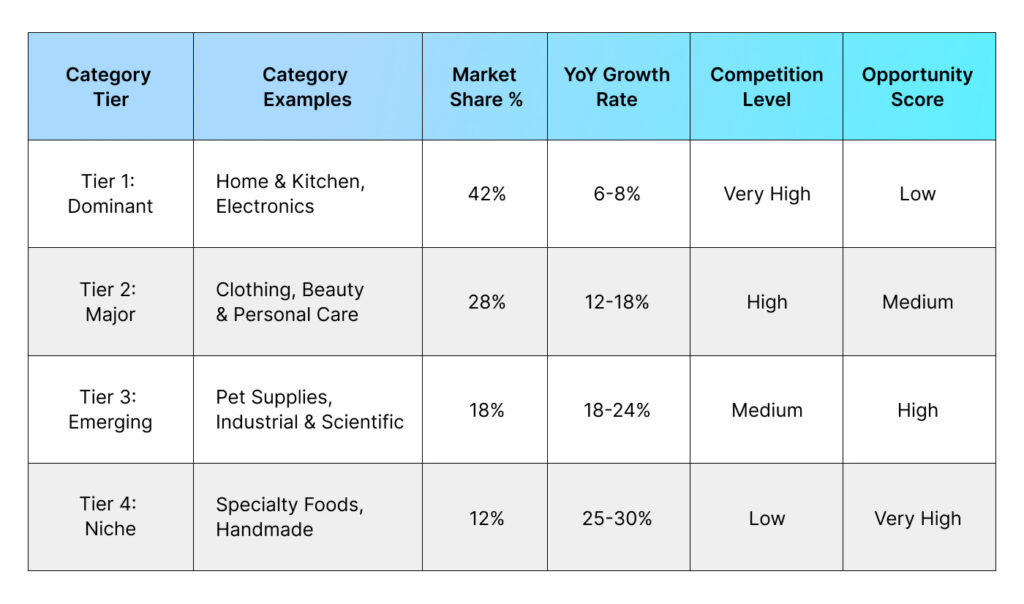
This table shows that while dominant categories hold the largest share, emerging and niche tiers offer significantly higher growth rates and opportunity scores for focused sellers.
Emerging Categories Are Quietly Eating Market Share
While everyone’s fighting over kitchen gadgets, categories like Pet Supplies, Beauty & Personal Care, and Industrial & Scientific are growing their Amazon E Commerce Market Share at 18–24% year-over-year. That’s nearly double the platform’s overall growth rate.
Pet Supplies, in particular, is fascinating. It’s not just “dog toys” anymore. It’s “dental chews for senior dogs,” “calming collars for anxious cats,” “biodegradable poop bags with handles.” These micro-niches are where Market Share for Amazon is actually consolidating because they’re too small for big brands to care about—but big enough for a focused seller to dominate.
Key Finding #2: Amazon E Commerce Market Share Growth Is Fragmenting

Beauty and Personal Care: The Dark Horse
If there’s one category that’s defying expectations, it’s Beauty. Amazon Market Share for Beauty & Personal Care jumped from 3.8% to 5.2% of total Amazon revenue in just 18 months. That’s a massive shift.
What’s driving it? Two things: premium indie brands and ingredient-focused sub-niches. Sellers who built around “vegan retinol serum” or “sulfate-free shampoo for curly hair” saw 3x faster growth than those chasing “face cream.” The Amazon Market Share by Category data proves that specificity wins.
Electronics: Maturing But Still Massive
Electronics remains a Tier 1 giant, but its Amazon E Commerce Market Share growth has slowed to 6% annually—below the platform average. It’s saturated. The days of launching a random phone case and printing money are over.
However, within Electronics, there’s a clear split. Commodity items (cables, basic chargers) are margin-crushed. But specialized gear—“gaming microphones for streaming,” “smart home sensors for renters”—still commands healthy margins and stable rankings. The Market Share for Amazon in Electronics is bifurcating: thin margins at the bottom, strong returns at the top of sub-niches.
Key Finding #3: Market Share for Amazon Is Shifting to Sub-Categories
The Rise of Niche Authority
Here’s a pattern we saw across every major category: Amazon Market Share by Category is becoming less relevant than Amazon Market Share by Sub-Category. The algorithm is rewarding depth over breadth.
Sellers who positioned themselves as the go-to brand for a specific problem—not just a product—saw 40% higher repeat purchase rates. For example, a seller focused on “compression socks for nurses” outperformed a general “compression socks” seller by 2.5x in profit margin, despite lower overall sales volume.
The data shows that Amazon E Commerce Market Share is consolidating around authority. When you own a sub-niche, you own the customer relationship, and that’s where the real value lives.
Private Label’s Hidden Impact
Private label sellers now account for 58% of Market Share for Amazon in categories like Home & Kitchen and Sports & Outdoors. But here’s what’s not obvious: they’re not competing on price anymore. They’re competing on brand perception within sub-categories.
A generic “yoga mat” seller struggles. A private label brand selling “extra thick yoga mats for knee pain” with consistent A+ content and review velocity thrives. The Amazon Market Share by Category numbers look crowded, but the sub-category data tells a different story—there’s room if you’re specific.
Key Finding #4: International Markets Are Redefining Amazon Market Share
UK and DE Show Different Patterns
Amazon Market Share isn’t uniform globally. In the UK, Beauty & Personal Care is even stronger, representing 6.8% of total marketplace revenue (vs. 5.2% in the US). In Germany, Industrial & Scientific is a Tier 2 category, commanding 8.3% of Amazon E Commerce Market Share—nearly double its US presence.
This matters because many US sellers overlook international expansion, thinking it’s too complex. But the Market Share for Amazon data shows that category winners in the US can often replicate success in UK/DE by simply localizing their sub-niche positioning. The demand patterns are surprisingly similar; the competition is just less intense.
How to Rethink Your Category Strategy for 2025-26

Stop Chasing “Hot” Categories
Here’s the hard truth: by the time a category is labeled “hot,” the Amazon Market Share by Category data is already saturated with new sellers. The window is closing. Instead of following trends, follow the data trail of underserved sub-niches.
Use tools to filter for high-volume, low-competition sub-categories. Look for keywords where Amazon Search Keywords show steady growth but listing quality is mediocre. That’s your signal.
Validate Sub-Niche Demand First
Before you order 1,000 units, validate. Run a small test batch. Create a landing page. Use Amazon’s Brand Analytics to see if Amazon Keywords in your sub-niche have rising search frequency rank. Check if the top listings have review gaps you can fill.
The sellers who win in 2026 won’t be the ones who bet big on broad categories. They’ll be the ones who validated small, then scaled deep into a proven sub-niche where Amazon Market Share is still consolidating.
A Practical 4-Step Category Selection Workflow
- Map the category landscape: Use Sellerite or similar tools to pull revenue and competition data for your target Amazon Market Share by Category. Don’t just look at the top level—drill into sub-categories.
- Identify sub-niche gaps: Look for keywords with high search volume but low listing quality scores. These are your entry points.
- Test with a focused SKU: Launch one product that solves a specific problem within that sub-niche. Optimize your Amazon Backend Keywords for long-tail variants.
- Measure share of voice: Track your percentage of total reviews and sales for that sub-niche over 90 days. If you’re gaining share, double down. If not, pivot fast.
This workflow keeps you agile and data-driven, not emotionally attached to a failing category.
What Sellers Must Internalize About Amazon Market Share
The big picture from our Amazon Market Share analysis is this: growth is fragmenting, and the winners are those who look past obvious categories into the sub-segments where Amazon E Commerce Market Share is actually consolidating.
Beauty, Pet Supplies, and select pockets of Industrial & Scientific offer real momentum, but only if you enter with a differentiated offer and a plan to capture repeat buyers. For Sellerite users, the path forward is to treat Amazon Market Share by Category as a starting filter, then validate, test, and refine based on real buyer behavior—not just aggregated growth stats.
If you can pair strong category signals with your own strengths and a disciplined sub-niche focus, you’ll be positioned to grow in 2026 while others are still fighting over yesterday’s hot products.
Conclusion — The Real Money Lives in the Gaps, Not the Crowds

Amazon Market Share is a moving target, but it’s not random. The data shows clear patterns: the big categories are fragmenting, sub-niches are consolidating, and international markets offer untapped mirrors of US success.
Your job isn’t to chase the biggest slice of the pie—it’s to find a slice that’s growing and own it completely.
Stop asking “which category should I sell in?” Start asking “which sub-niche can I dominate?” That’s the question that will define Market Share for Amazon winners in 2026.
