
Why Refund Rate Data Matters More In 2026
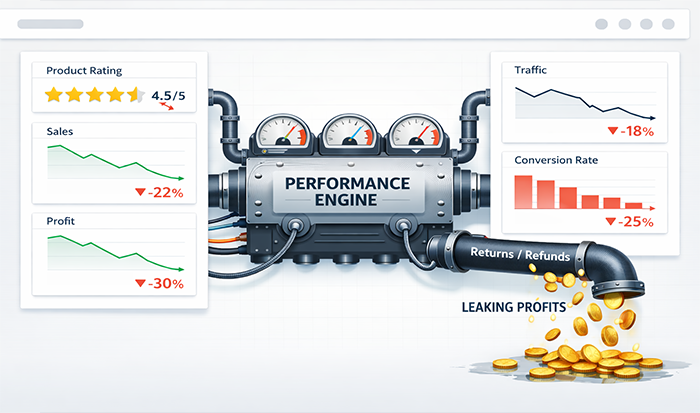
If you have been selling on Amazon for a while, you already know that refunds are never just refunds. They look small in isolation, a returned unit here, a customer reimbursement there but once the pattern starts building, the effect spreads across profit, conversion, listing trust, and your wider Amazon Seller Performance Metrics.
That is exactly why this Sellerite report matters in 2026. The conversation around Refund Rate Amazon performance is no longer just about customer service. It now connects directly to Voice of the Customer visibility, “Frequently Returned Item” labeling, category return thresholds, and the operational cost pressure sellers feel inside FBA.
The bigger shift is this: Amazon is giving sellers more data on returns, but also more accountability. The result is that the refund rate is becoming one of the clearest early-warning signals in the business. It tells you when the listing promise and the buyer experience are drifting apart, often long before a more obvious account-level problem shows up.

How We Define Amazon Refund Rate For This Report
What the metric actually measures
At its core, the Amazon Refund Rate measures the percentage of sold units that end up refunded during a selected time period. One widely cited formula is straightforward: refunded units divided by units sold, multiplied by 100.
That sounds simple, but the implications are not. A rising refund rate can point to several different problems at once:
- Product quality issues.
- Misleading or incomplete listing content.
- Sizing or compatibility confusion.
- Packaging and damage problems.
- Buyer expectation mismatch.
This is why sellers should not treat Refund Rate Amazon data as just a finance metric. It behaves more like a product-market feedback metric. When the number moves in the wrong direction, something in the customer experience is usually breaking.
Why “refund rate” is different from direct account health metrics
This part is important. Refunds do not sit inside Amazon’s Order Defect Rate the same way negative feedback, A-to-z claims, and chargebacks do. Amazon’s published performance structure for ODR focuses on those three factors, with the target kept below 1%. Seller forum guidance also indicates that refunds or partial refunds themselves do not directly count against core seller performance metrics in the same way.
But that does not mean refunds are harmless. High refund volume can still damage performance indirectly by affecting customer satisfaction, profitability, VOC signals, and listing-level trust. In other words, the refund rate may not always punish you through a single headline metric, but it can still drag down the ecosystem around the ASIN.
What The 2026 Data Tells Us About Amazon Refund Rate
The most useful benchmarks
Amazon does not publish one universal “good” refund rate for every category, and that makes sense because return behavior varies widely by product type. Still, several 2025–2026 seller analyses suggest a useful working framework:
- Under 3% is often considered healthy for many categories.
- Around 3% to 5% is the caution zone and worth active review.
- Above 5% usually calls for immediate intervention.
- Electronics and apparel often run much higher, sometimes in the 8% to 12% range.
- Low-return categories like grocery or supplements generally need to stay much tighter.
On the FBA side, Amazon’s category return-rate thresholds now matter more financially because returns processing fee thresholds vary by category. Publicly cited 2024 threshold examples ranged from 2.9% for grocery to 12.8% for backpacks, with 4.8% for “everything else.” That means Amazon FBA Refund Rate pressure is no longer just about lost revenue; in many categories it can trigger extra cost exposure too.
Why the “Frequently Returned Item” badge changed the game
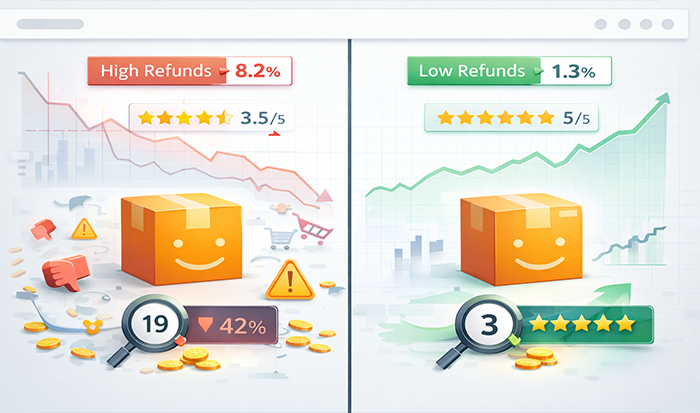
One of the biggest shifts in recent years is the visibility of return behavior. Amazon’s “Frequently Returned Item” badge compares an ASIN’s return rate with similar items in the same category and uses enough sales volume to improve reliability.
That badge matters because it changes the impact of refunds from internal pain to public friction. Once shoppers see that label, hesitation rises before the click even becomes a conversion. In practical terms, a weak Amazon Refund Rate can start hurting both trust and sales velocity at the same time.
Amazon Refund Rate Impact At A Glance
This is the real takeaway: Amazon FBA Refund Rate data is not just a post-sale number. It is one of the clearest indicators of whether your listing, product, and operations are actually aligned.
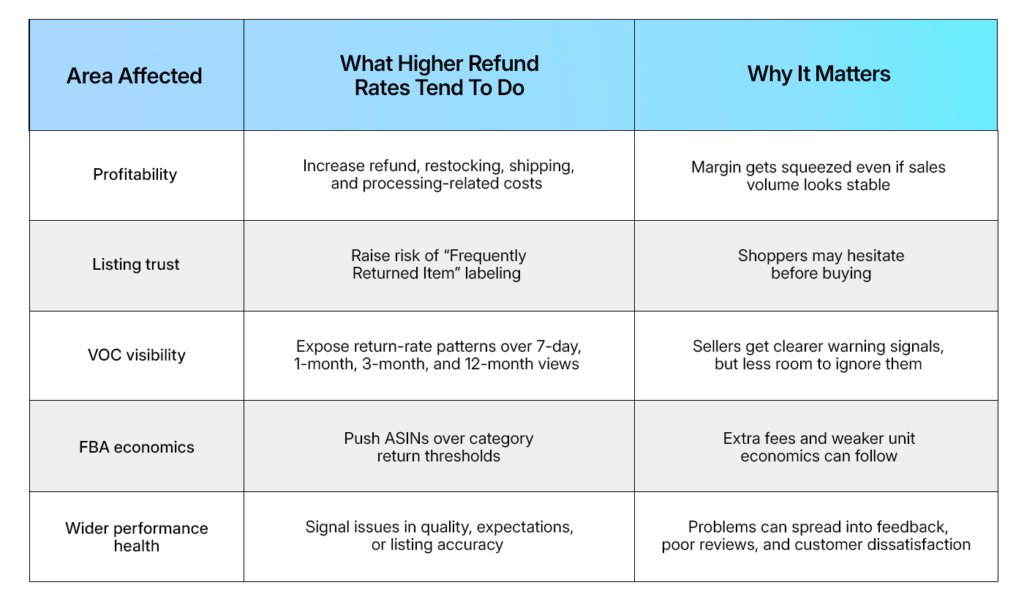
Where Refund Rate Hits Seller Performance Metrics Indirectly
Refunds may not always show up as a direct strike against account health, but they still shape the metrics environment around your business. That indirect effect is what many sellers underestimate.
A higher Refund Rate Amazon pattern often leads to:
- More disappointed customers can increase the risk of negative feedback.
- More expectation mismatch, which can surface in reviews and Q&A.
- Lower conversion if shoppers see return-related warning signals.
- More operational drag through inventory damage, reimbursements, and reverse logistics.
This matters because Amazon evaluates sellers through a broad customer-experience lens, not just one dashboard figure. If refunds are climbing because the product disappoints buyers, that disappointment often shows up elsewhere too.
What Usually Causes a High Amazon Refund Rate
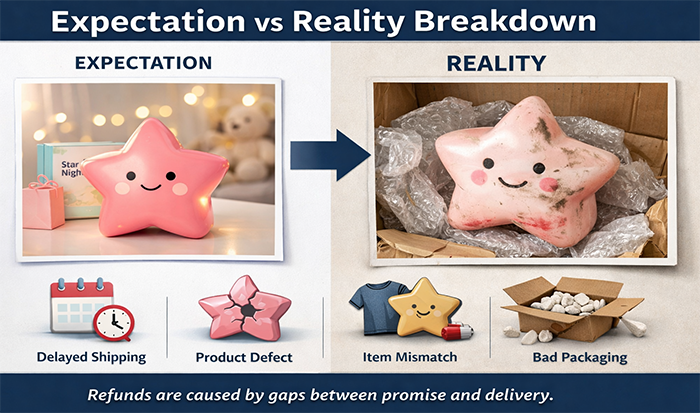
The data and seller commentary point to a pattern that feels very familiar in practice: most refund problems come from a mismatch between what the buyer expected and what actually arrived.
The most common causes include:
- The product didn’t meet expectations.
- Listing images or descriptions overstated the product.
- Size, fit, or compatibility confusion.
- Damage or packaging issues in transit.
- Subjective buyer reasons, such as “no longer needed” or accidental order, still add up materially in many categories.
That last point is worth noticing. One seller discussion breakdown suggested that subjective and non-defect return reasons can represent a very large share of refunds in some cases. So reducing the refund rate is not always about “fixing the product” alone. Sometimes it is about making the buying decision clearer before checkout.
A Sellerite-Style Workflow To Control Refund Rate
If you want to improve Amazon Seller Performance Metrics, the refund rate needs to become a routine review item, not an occasional surprise.
A practical workflow looks like this:
- Monitor refund trends by ASIN, not just account-wide averages.
- Review VOC return-rate windows across trailing 7-day, 1-month, 3-month, and 12-month periods.
- Group return reasons into operational buckets: quality, listing mismatch, damage, buyer confusion, and subjective reasons.
- Update the listing first if the issue is related to expectations.
- Escalate to product or packaging changes if the same complaint repeats.
- Recheck whether the ASIN is nearing category thresholds that create fee pressure in FBA.
This is where the smartest sellers separate themselves. They do not argue with the refund data. They use it as product intelligence.
What This Means For Your 2026 Strategy

The headline from this report is clear: Amazon Refund Rate may not always hit a single seller metric directly, but it absolutely shapes the wider performance picture in 2026. It affects margin, confversion, customer trust, and how safely an ASIN can scale under FBA economics.
For Sellerite users and data-driven brands, the practical move is to treat Refund Rate Amazon as an early diagnostic signal. Watch it the same way you watch conversion rate or TACoS. If it rises, dig fast. If it stays low while sales grow, that usually means your product promise is holding up in the real world.
And that is really the deeper point. Strong Amazon Seller Performance Metrics are not built only by getting the sale. They are built by making sure the customer still feels good about that sale after the box arrives.
